Inserting a geographic map
This document explains how to insert geographic map into a page report, web report and library component respectively.
Inserting a geographic map to a page report
- Position the mouse pointer at the destination where you want to insert the geographic map.
A geographic map can be inserted into the page report areas listed in Component placement, or the blank area in a library component or web report.
- Do one of the following to open the Create Geographic Map wizard:
- Click Insert > Map > Geographic Map on the menu bar.
- Drag Geographic Map from the Toolbox panel.
- Click the Insert Geographic Map button
 on the Insert toolbar.
- In the Data screen of the wizard, define or select the dataset on which the geographic map will be created.
- New
If checked, the geographic map will be built on a new dataset created from the catalog resources.
- Existing
If checked, specify the dataset in the current report from which the geographic map will be created.
- Current
If checked, the geographic map will be built on the dataset which is used by its parent.
- In the Group screen, add the fields as the grouping criteria, and then specify the sorting direction of each group level in the Sort column (for details, see the same topic Grouping the data on table).
- In the Filter screen, you may define some optional filter conditions to filter the data displayed in the geographic map (for details, see the same topic Filtering the data on table).
- In the Layout screen, specify the geographic data for the geographic map, which is GeoData.xml in the
<install_root>\gisinfo directory by default. If the XML file that you specify does not exist it will be created in the <install_root>\gisinfo directory. The geographic data XML file is used to map the geographic latitude and longitude coordinates from Google Maps, OpenStreetMap or OpenCycleMap based on the location information specified for each group in the Marker tab. When the location information key string of a group value matches the "nm" field in the XML file, you will get the related latitude and longitude value for this group value.
You can also import an XML file which contains predefined geographic data including latitude and longitude for the specific "nm" field. By default, the XML file is located in the <install_root>\gisinfo directory, if not, the file will be copied to this directory after it is imported. When you publish the report from Designer you can specify the gisinfo files to publish to the Server from the Geographic Information tab.
If you do not publish the geographical information it will be created automatically when you first run the report.
Then specify the map type from the Map Type drop-down list, which can be Google Maps - Roadmap, Google Maps - Satellite, Google Maps - Terrain, OpenStreetMap - Standard, OpenCycleMap - Cycle Map or OpenCycleMap - Transport Map.
- In the Marker screen, select each group level from the Geographic Map box and specify its marker properties.
Specify the location of the markers by selecting a DBField or a formula from the Location Info drop-down list which contains the values matching the "nm" field in the geographic data XML file. The values seen in this Location Info field will be used to create the "nm" field values when the XML does not already exist.
Specify the tip information which displays when you hover the mouse on the markers at runtime by typing it in the Marker Tip text box directly. You can also use a formula to control the tip.
To customize the image for the markers, uncheck the Default Icon option, then specify the image, the shadow image (only available for Google Maps types), and their width and height respectively. If you want to change the width and height for the image/shadow image at the same time in a certain proportion, check Constrain Proportion.
Specify whether to show or hide the markers. You can simply select true or false from the Hide Markers drop-down list, or use a formula to control it.
- Click Finish to insert the geographic map.
If you have used the menu or toolbar command to insert the geographic map into a page report, and specified to insert it to position other than the report body or tabular cell, after clicking Finish in the wizard, you need to drag it to the destination using your mouse in order to insert the geographic map where you want it.
Inserting a geographic map to a web report
- Follow above steps 1 and 2 in inserting a geographic map to a page report to open the Create Geographic Map wizard.
- In the Data screen of the wizard, select a business view in the current catalog on which the geographic map will be created.
- In the Display screen, specify the map type from the Map Type drop-down list, it could be OpenStreetMap - Standard, OpenCycleMap - Cycle Map, OpenCycleMap - Transport Map, Google Maps - Roadmap, Google Maps - Satellite or Google Maps - Terrain.
- The Resources box lists all the elements in the selected business view, you can further edit the business view if you want.
To edit the business view, right-click the business view or any element in it and select Edit from the shortcut menu. The Business View Editor window is displayed. Edit the business view as you want.
To change the display name of the business view or an element, right-click the business view or the element and select Rename from the shortcut menu. Enter the new name in the name text box and click outside of the box to confirm the new name.
To delete an element, right-click the element and select Delete from the shortcut menu.
- Add the fields from the Resources box to the Drill Path box as the grouping criteria. If needed, specify the Select N condition for each group level. To adjust the order of the added group levels, select the group and click
 or
or  above the Drill Path box. To remove a group level, select the group and click
  .
.
To specify the Select N condition for a group:
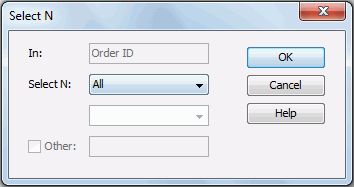
- Select the group by field in the Drill Path box, then click the Select N button. The Select N dialog appears. See the dialog.
- You will see that the field you have just selected is displayed in the In text box. From the Select N drop-down list, select Top or Bottom, and then further specify a number or an Integer-typed parameter. If the number or the parameter value is N, then the first or last N groups in that group level will be displayed.
- To display all the other groups that do not match the Select N condition (which are by default hidden) in an additional group, check the Other box and type a name for the additional group.
- Click OK to accept the condition.
- To enable setting the marker and area properties for all groups, check the Enable Marker and Enable Area checkboxes (one of the two checkboxes must be checked at least and Enable Marker is checked by default).
- Select each group level from the Drill Path box and specify its marker properties.
- Specify the shape of the markers in any of the following ways.
- If you want to use a shape as the markers, click
 next to the Shape By box and select a shape from the shape list, then click outside of the shape list to apply the selected shape.
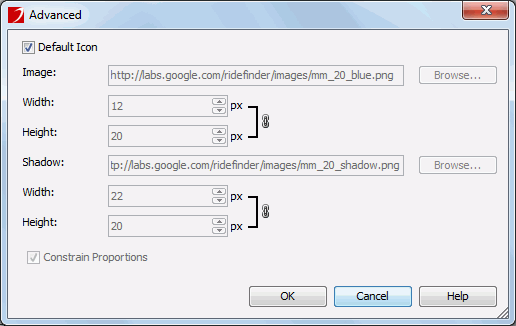
- If you want to use an image to be the shape of the markers, click , then check the checkbox ahead of the Advanced option in the shape list. A default image will then be applied as the shape of the markers. If you want to customize the image, after checking the checkbox, click Advanced to open the Advanced dialog to specify the image. See the dialog.
- Uncheck the Default Icon option.
- Input the URL for a web image in the Image text box, or click the Browse button to specify a local image.
- Specify the width and height of the image.
- If you want to change the width and height for the image at the same time in a certain proportion, check Constrain Proportion.
- If the map is of any Google Maps type, you can further specify a shadow image for the markers.
- When done, click OK to apply the images and return to the map wizard.
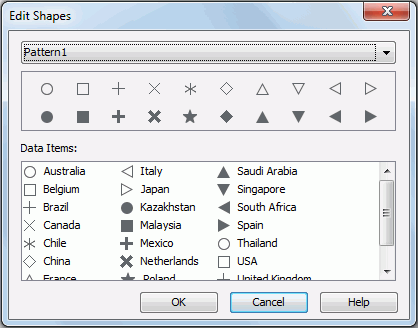
- If you want to control the shapes of the markers by field values, select the group field that represents the currently selected group level, or a group field of a higher level than the current level in the Drill Path box, or an aggregation field from the Resources box and click
 to add it to the Shape By text box, then click to open the Edit Shapes dialog to edit the shapes. See the dialog.
- From the shape pattern drop-down list, select the required pattern. A preview of the shapes in the selected pattern will be displayed in the box below.
- The field values with the shapes in the selected pattern are listed in the Data Items box. You can change the shape for each value by selecting it and then clicking a shape in the preview box. Note that if an aggregation field has been added to control the shapes, the Data Items box will be blank. You cannot customize the shapes and the default shapes in the selected pattern will be applied at runtime.
- Click OK to apply the specified shapes to the markers and return to the map wizard.
- Specify the color of the markers in any of the following ways.
- Click
 next to the Color By text box and select a color from the color palette or click More Colors on the color palette to open the Pick a Color dialog, with which you can set a full range of color.
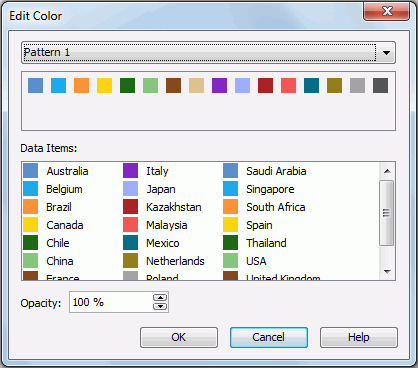
- If you want to control the colors of the markers by group values, select the group field that represents the currently selected group level, or a group field of a higher level than the current level in the Drill Path box from the Resources box and click to add it to the Shape By text box. You can add more than one group fields and when several group fields are added, you can adjust the order of the fields by dragging and dropping them in the text box. Click to open the Edit Color dialog to edit the colors. See the dialog.
- From the color pattern drop-down list, select the required pattern. A preview of the colors in the selected pattern will be displayed in the box below.
- The field values with the colors in the selected pattern are listed in the Data Items box. You can change the color for each value by selecting it and then clicking a color in the preview box.
- Specify the opacity of the colors in the Opacity text box.
- Click OK to apply the specified colors to the markers and return to the map wizard.
- If you want to control the colors of the markers by aggregation values, select an aggregation field from the Resources box and click to add it to the Color By text box, then click to open the Edit Gradient Color dialog to edit the colors. See the dialog.
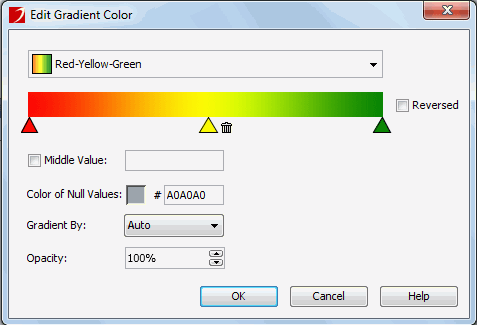
- Select a gradient color from the color drop-down list. A preview of the gradient color will be displayed on the color bar.
- You can further customize the gradient start color, middle color and end color by clicking the corresponding triangle below the color bar to select a color from the color palette or click More Colors on the color palette to access the Pick a Color dialog in which you can select a color within a wider range. The middle and start colors can be deleted, however, if the start color is deleted, a default start color will still be applied automatically. To add the start and middle colors back, click + and specify the color on the color palette. After you change a default gradient color, it will be saved as a customized gradient color and you will find the name changed to Customize in the color drop-down list.
- Click Reversed if you want to reverse the direction of the gradient color.
-
Check the Middle Value checkbox and specify the middle data value mapping to the middle color, which takes effect only when the middle color is not null. Then the gradient color will change from the start color to the middle color, and then change from the middle color to the end color. You can also set the middle value to 0 and check the Auto Expand Start/End value checkbox, in which case, the negative and positive values of the maximum absolute value will be used to map to the start color and end color, and 0 will always be in the center of the data range.
-
Click the color image button beside Color of Null Values to specify a color for null values on the color palette, or click More Colors on the color palette to access the Pick a Color dialog in which you can select a color within a wider range, or you can input the hexadecimal value of a color directly in the text box after #.
-
Select a gradient color algorithm between two colors from the Gradient By drop-down list, which can be Auto, RGB or HSL.
-
Specify the opacity of the gradient color in the Opacity text box.
-
Click OK to apply the specified gradient color to the markers and return to the map wizard.
- Select an aggregation field from the Resources box and click to add it to the Size By text box if you want to control the size of the markers by aggregation values, then click
 next to the Size By text box to specify the zoom percentage based on the default size. To restore the default size, click Reset.
- Add the fields to the Label By text box to specify the labels shown above the markers, then click
 next to the Label By text box to set the font properties of the labels. When more than one field is added, you can adjust the order of the fields by dragging and dropping them in the text box.
- Type the tip information which displays when you hover the mouse on the markers at runtime in the Marker Tip text box directly. You can also use a formula to control the tip.
- Select each group level from the Drill Path box and specify its area properties.
- Specifies the colors that are used to fill the areas
in the Fill By text box using the same way for specifying the marker colors.
- Add the fields to the Label By text box to specify the labels shown above the areas, then click next to the Label By text box to set the font properties of the labels. When more than one field is added, you can adjust the order of the fields by dragging and dropping them in the text box.
- Type the tip information which displays when you hover the mouse on the areas at runtime in the Area Tip text box directly. You can also use a formula to control the tip.
- Select each group level from the Drill Path box and specify the location of the markers and areas of the group by selecting a DBField or a formula from the Location Info drop-down list which contains the values matching the folder name in
<install_root>\gisinfo\geocode. For example you may group by Country and State. For State, you would want to use a formula fStateCountry that concatenates state and country so Google Maps, OpenStreetMap or OpenCycleMap knows which state to use such as "New York, USA" or "California, USA".
- In the Filter screen, you may define some filter conditions to filter the data displayed in the geographic map. You can select a predefined filter from the specified business view if there is from the Filter drop-down list to apply, or select User Defined in the list to define a new filter.
- Click Finish to insert the geographic map.
Inserting a geographic map to a library component
- Follow above steps 1 to 9 in inserting a geographic map to a web report to specify the geographic map information in the Data and Display screens of the Create Geographic Map wizard.
- Select each group level from the Drill Path box to bind web behaviors to the markers and areas of the group.
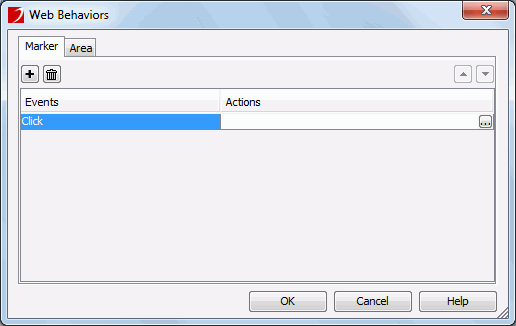
- Click the Web Behaviors button. The Web Behaviors dialog appears. See the dialog.
- In the Marker tab, select a trigger event from the drop-down list in the Events column, then click in the Actions column and click
 that appears in the text box to open the Web Action List dialog, where you can bind a web action to the markers which will be triggered when the specified event occurs on the markers.
To add a web behavior line, click  , and if a web behavior is not required, click to remove it.
Click or to adjust the order of the behaviors. Then at runtime, when an event that has been bound with more than one action happens, the upper action will be triggered first.
- Switch to the Area tab and follow the same steps to bind web behaviors to the map areas.
- Click OK to apply the web behaviors to the group and return to the map wizard.
The web actions you can bind to the map markers and areas include Filter, Sort, Parameter, Property and SendMessage. For details about these web actions, refer to Applying web actions to a label.
- In the Filter screen, you may define some filter conditions to filter the data displayed in the geographic map. You can select a predefined filter from the specified business view if there is from the Filter drop-down list to apply, or select User Defined in the list to define a new filter.
- Click Finish to insert the geographic map.
Once a geographic map has been created, you can further modify it by accessing its shortcut menu wizard which is composed by a set of screens that are similar to the wizard screens used to create the geographic map. Moreover, you can customize its appearance and behavior by setting properties in the Report Inspector, which can be saved as a CSS style for future use (for details, see Creating a CSS style).
After finishing the modification, you can also apply some filter conditions to narrow down the records displayed in the geographic map the same as you do for a table (for details, see Filtering the data). However, if the geographic map is created on an HDS, the conditions you define in the Format Filter dialog will not be applied when the geographic map runs due to the specialty of HDS. Therefore, if you want to filter the data displayed in such kind of geographic maps, you need to make use of the dataset filter.