

JDashboard is a new way of information delivery, using a user portal user interface rather than a web report or page report. Users can create, edit and browse dashboards from the JReport Console using JDashboard. With pre-built library components, users can freely choose the objects they want to display in the dashboard, without having to know how these objects were created, what data sources to use, what styles to set, etc. A dashboard can hold multiple library components so that when browsing the dashboard users are able to see multiple data aspects. Within a dashboard, library components are able to communicate with each other via the message mechanism. This allows actions such as common filters to be applied to all the components of a dashboard even when coming from different data sources.
Note: A JDashboard license for JReport Server is required in order to perform this track. If you do not have the licenses, please contact your Jinfonet Software account manager to obtain it first.
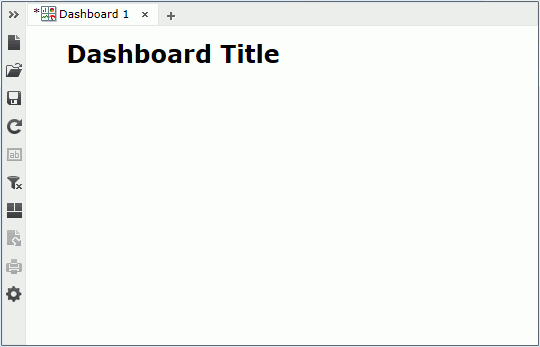
 on the toolbar to display the Resources panel which lists all the data resources and components that can be inserted in dashboards, then go to Component Library > Public Components and drag Sales by Category.lc to the dashboard body.
  on the top right of the Resources panel or click
  on the toolbar to hide the Resources panel.
  on the toolbar to align the two library components.
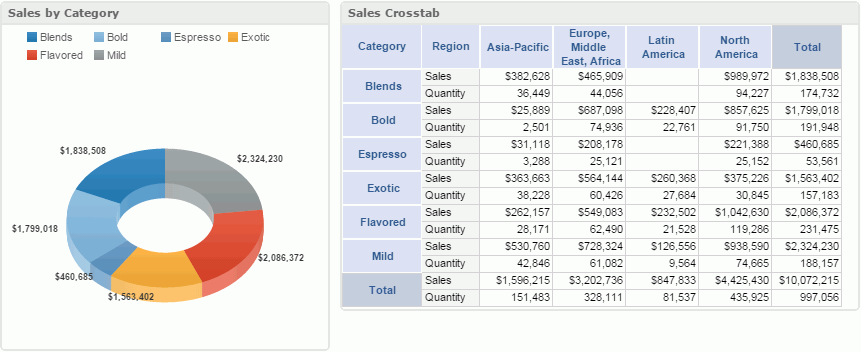
 on the toolbar to save the dashboard. In the Save As dialog, replace the File Name Dashboard 1 with Products in the File Name text box, and click OK.
This task shows the case of sending a filter message from one library component to another.
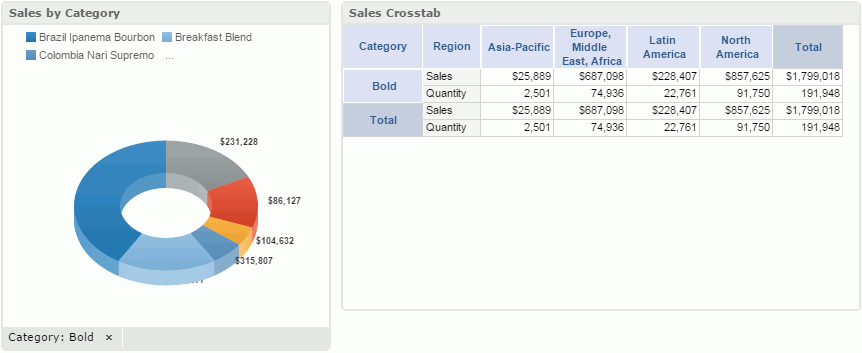
 on the toolbar to save the dashboard.
 Report components created from business views can be inserted in dashboards directly.
 on the toolbar to display the Resources panel, then go to Reports > Public Reports, expand ShipmentStatus.wls and drag TableComp to the dashboard body below the existing components. Hide the Resources panel.
  on the toolbar to align the three library components.
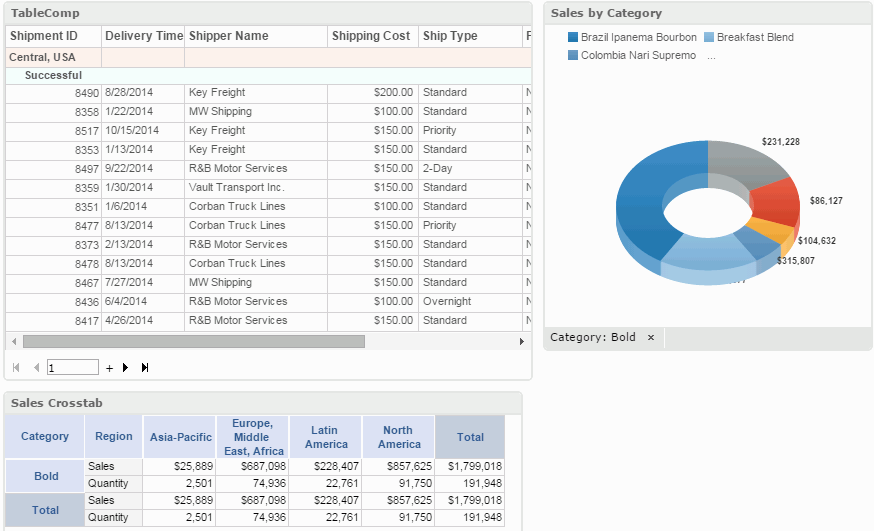
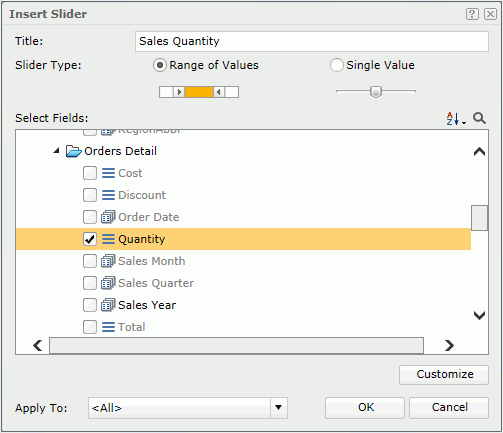
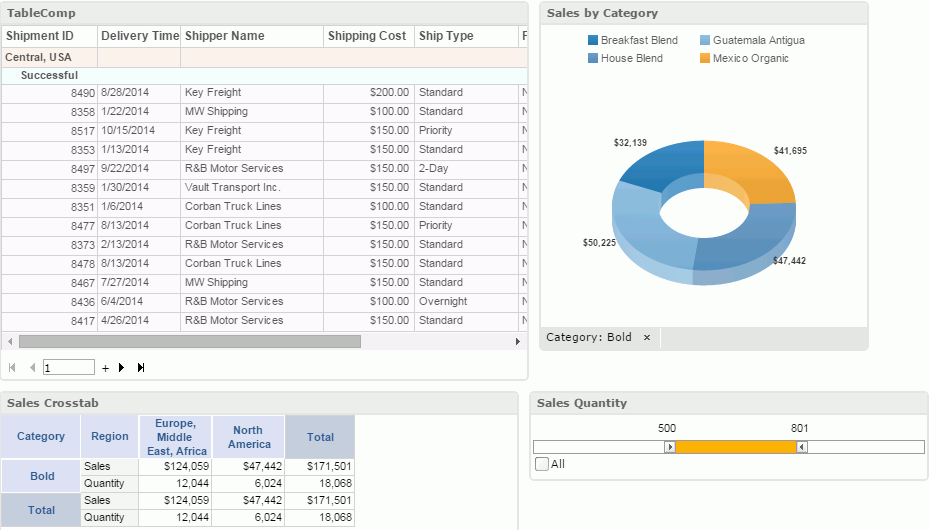
 on the toolbar to display the Resources panel. From the Toolbox node, drag Slider to the dashboard body below the chart.
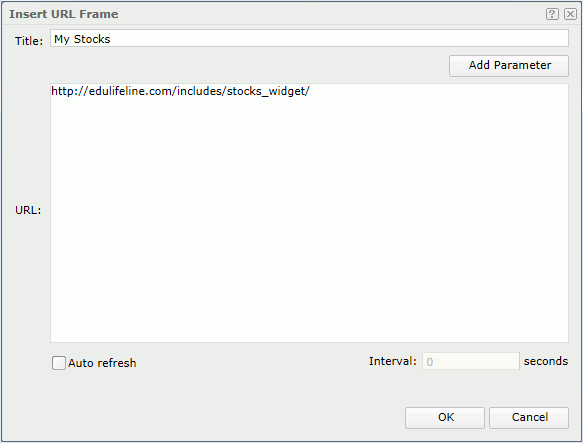
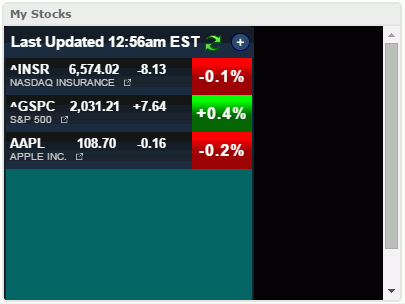
 on the toolbar to display the Resources panel, scroll down and drag a URL Frame component from Toolbox to the dashboard body below the slider.
 on the toolbar to access the Export dialog.
By default, all the exportable library components are arranged using a tabular style according to their positions in the dashboard in the design panel (right hand side). Each tabular cell can hold no more than one component. There are two blank cells to the right of the crosstab where the slider and the gadget reside. Sliders and gadgets cannot be exported so they are not available here.
We will remove the chart on the right of the table and add it below the crosstab.
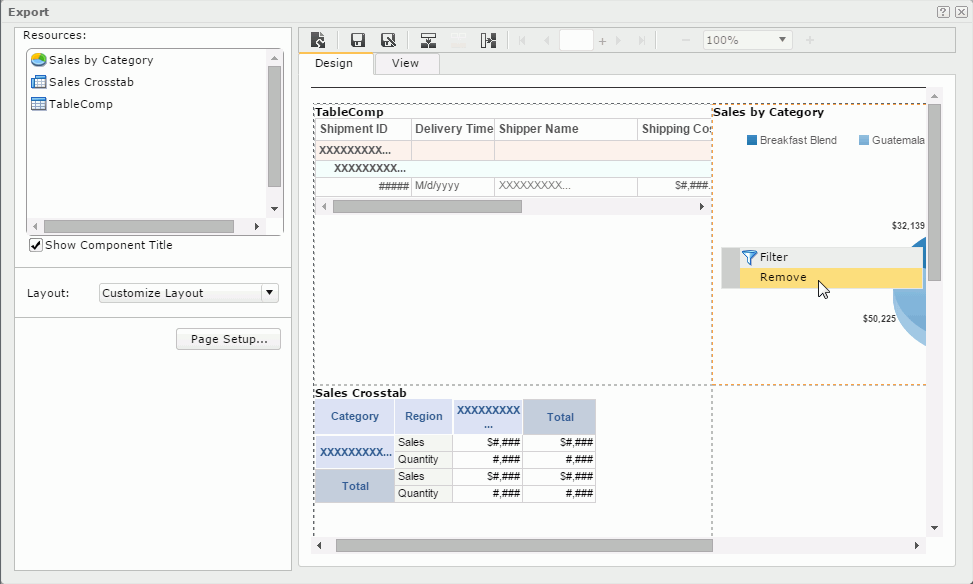

 on the toolbar, then drag the chart - Sales by Category - from the Resources box to the lower cell.
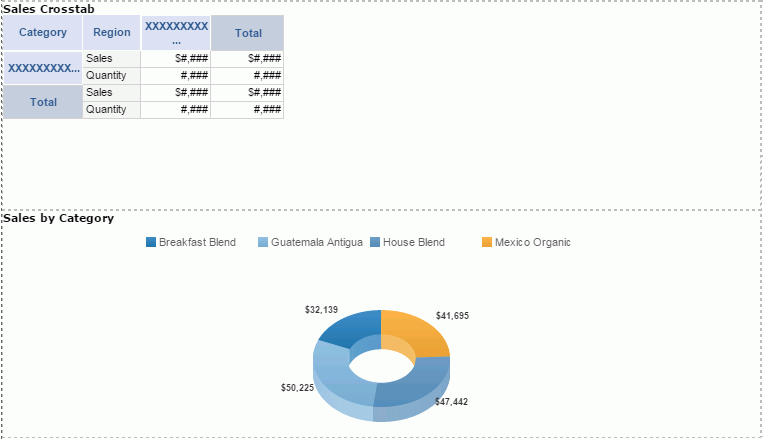
 on the toolbar, in the Save As dialog, type Layout1 in the Name text box and click OK. You will see that Layout1 is added in the Layout drop-down list and selected as the value.
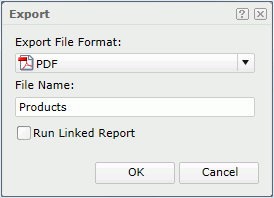
  in the Export dialog to do final setting and then start exporting. In the Export dialog,
click OK. The exporting process will begin.
 in the upper right corner.
When a component uses parameters, you can make use of the configuration panel to change the parameter values.
 that appears on the title bar, select Edit Setting from the drop-down list to display the parameters.
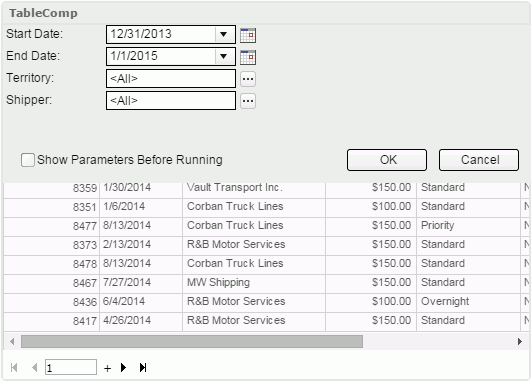
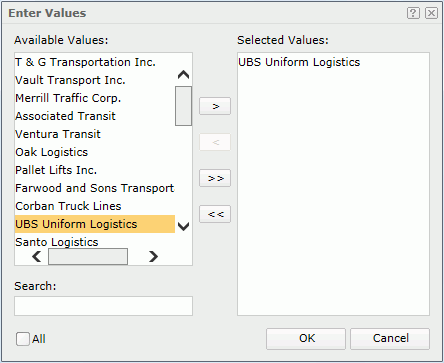
 to display the Enter Values dialog. Uncheck the All option. Select UBS Uniform Logistics and click
  to add it to the right box. Then click OK.

When two or more library components in a dashboard contain parameters that meet the following cases, the parameters can be shared among components. After sharing parameters, we just need to provide values to one group of the parameters and all related components will be able to receive them.
The following example illustrates two components sharing similar parameters.
 on the dashboard title bar to add a new dashboard. A new tab will be created, labeled Dashboard 2.
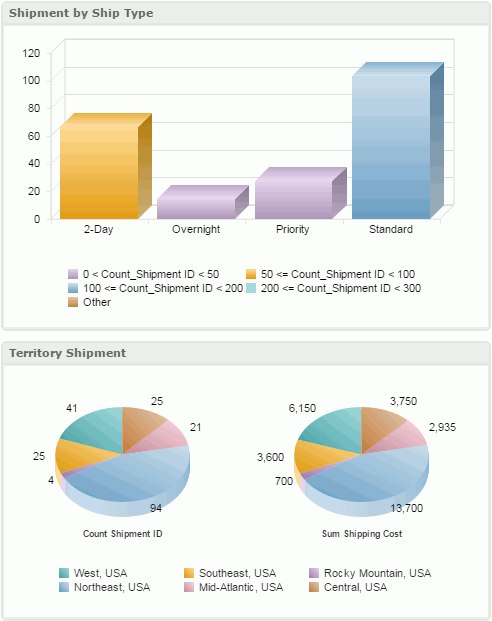
 on the toolbar to display the Resources panel, expand Component Library > Public Components and drag Count Shipment by Ship Type.lc and Count Shipment by Territory.lc one by one to the dashboard body. Hide the Resources panel.
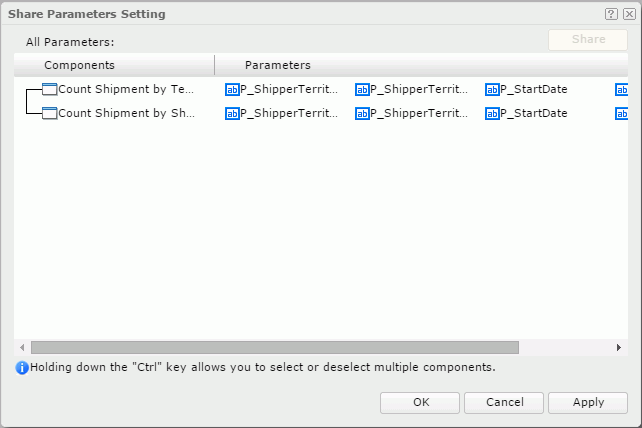
 on the toolbar and select Share Parameter. The displayed dialog shows that the two library components have shared parameters.
Then click OK.
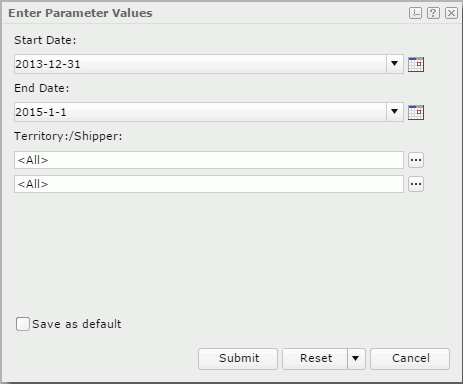
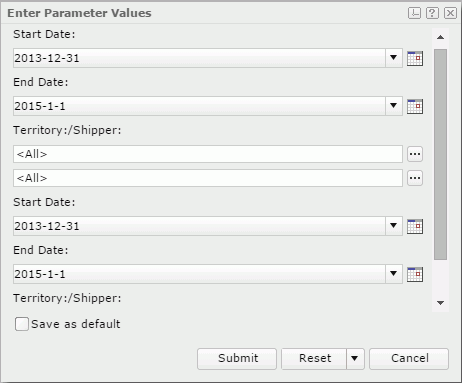
 on the toolbar to display the Enter Parameter Values dialog. The Count Shipment by Ship Type and Count Shipment by Territory components match parameters. Both components share the same number of parameters and both share the same data type of parameters. Parameter 1 and 2: Start Date/End Date (parameter) = Date (data type) for both components. Parameter 3: Territory/Shipper (parameter) = Text (data type) for both components. If the number of parameters are the same and the data types are the same, two different components can share the same parameters.
Exit the
Enter Parameter Values dialog.
 on the toolbar and select Share Parameter. In the displayed dialog, select either component and click the Cancel Share button. Then click OK.
  on the toolbar to access the Enter Parameter Values dialog again. Now it lists separate pairs of the Start Date, End Date, and Territory/Shipper parameters used by the two library components.
Click Cancel to exit the dialog.
 on the toolbar to save the dashboard. In the Save As dialog, change the File Name from Dashboard 2 to Shipment and click OK.
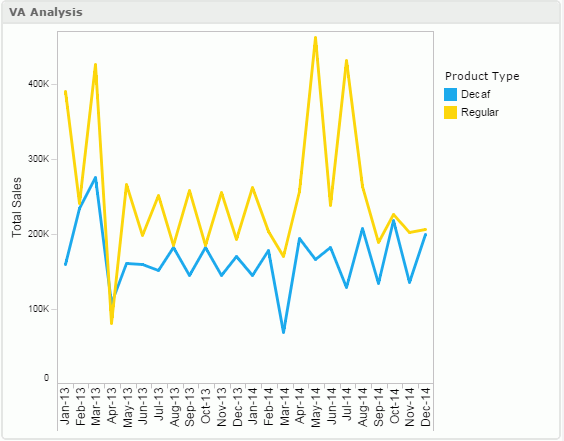
  on the toolbar to display the Resources panel, then go to Reports > Public Reports, expand VA Analysis.va and you will find a VCTObject under it. Drag the VCTObject into the dashboard body.
 on the toolbar to display the Resources panel, then go to Reports > Public Reports and drag Coffee Sales.wls to the dashboard body. Hide the Resources panel.
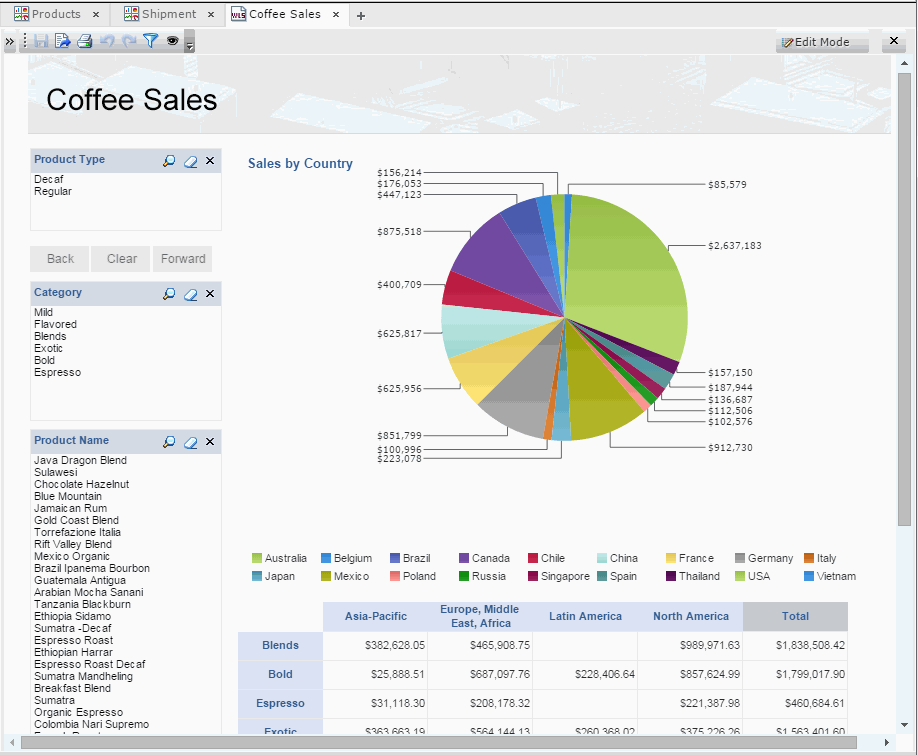
Keep the JDashboard window open and we will continue from the task 10. There is currently a browser session open from JReport Server console and a popup window containing JDashboard.
 on the toolbar and you will see Set as Server Home is enabled on the menu list. Click the option to set JDashboard with the Shipment dashboard active as the server home page.
In this track, we first created a dashboard by inserting two library components, a report component, a slider, a third party gadget, and a Visual Analysis component, and performed operations in the dashboard such as delivering the filtering message predefined between two library components, filtering the data using the slider, exporting the library components, changing parameter values via the configuration panel, sharing component parameters, setting JDashboard as the server home for easier access, and running a report in JDashboard.