

Obtaining detailed information from a banded object
In a banded object which contains group information, you may only care about the details in a certain group. To meet your expectation, JReport provides a function: go-to-detail.
Going to detail from a field/label/image
If a banded object contains group information, then a field (DBField, parameter, formula, summary, special field), label, or image in a group header/footer panel of the banded object, including the case that the field, label or image is in a tabular cell or text box which is in the banded object's group header/panel panel, can be used to obtain information of that group. To do this:
- In JReport Designer, open a page report which contains a grouped banded object.
- Select the object which will be used for going to detail, set its property Go to Detail to true in the Report Inspector.
- Find the property Detail Target Frame, then from its value drop-down list, select the target window or frame in which to display the detailed information.
- Publish the page report to JReport Server and run it in Page Report Studio.
- Right-click the object and select Go to Detail, then the related group information will be displayed.
Going to detail from a map
A map in a grouped banded object can also be used for going to detail with the following preconditions:
- The map inherits dataset from the banded object.
- The banded object has at least two groups.
- The map is inserted in the group header/footer panel that is not the lowest level group of the banded object.
To go to detail from a map:
- In JReport Designer, open a page report which contains a grouped banded object with a map.
- Select the map, then in the Report Inspector set its property Go to Detail to true, from the Detail Target Frame value drop-down list, select the target window or frame in which to display the detailed information.
- Publish the page report to JReport Server and run it in Page Report Studio.
- Right-click the map and select Go to Detail, then the related group information will be displayed.
Going to detail from a chart
A chart in a banded object can also be used for going to detail, however, some preconditions must be met:
- The value axis of the chart shows summary information.
- The chart inherits dataset from the banded object, and has no data container link with the banded object.
- In the case that FieldA and FieldB are respectively displayed on the series and category axes of the chart, then the two fields must be group fields of the banded objects, and FieldA is one-level higher than FieldB, and the chart must be inserted into the header/footer panel of the group which is one-level higher than FieldA (if FieldA is the highest group level in the banded object, then the chart should be inserted into the banded header/footer panel). In the case that the chart only shows FieldB as category information (no series axis), then FieldB must be a group field of the banded object, and the chart must be inserted into the header/footer panel of the group which is one-level higher than FieldB, or the banded header/footer panel if FieldB is the highest level.
The following example shows how to obtain detailed information from a chart:
- Create a standard banded report based on the query WorldWideSales in Data Source 1 of the catalog file SampleReports.cat. The standard banded report displays the following fields: the DBFields Product Name, Unit Price, Discount and Quantity and the formula Total, is grouped by Country, State and Category (Country is the highest level and Category the lowest), and applies the Classic style.
- In the Resource View panel, click <Add Summary...> from the Summaries node and create a summary named Sum_Total, which uses the function Sum, sums on the formula Total, and applies to the Category group level, then drag the summary to the footer panel of the Category group level in the banded object.
- Insert a Bar 3-D chart into the header panel of the Country group level. The chart inherits the dataset from the banded object (make sure to check the Current radio button in the Data screen of the Create Chart wizard), and displays Category on the category axis, State on the series axis and Sum_Total on the value axis.
- In the Report Inspector, select the node that represents the chart from the resource tree and set its Go to Detail property to true.
- Save the report and click View > Preview As > Page Report Result to preview it in Page Report Studio.
- Turn to page around 25 to view records in the USA country.
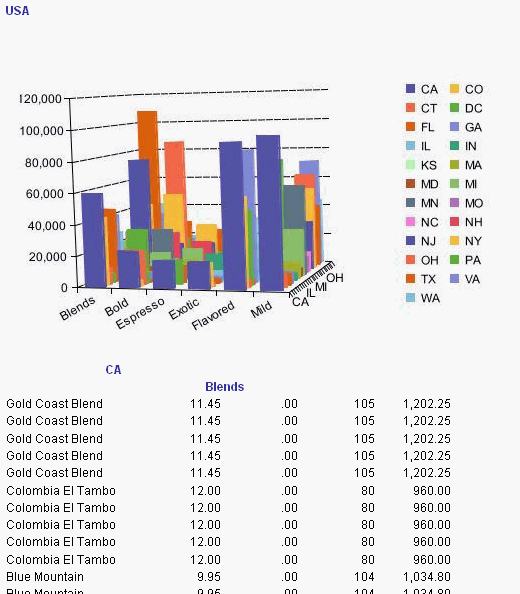
- Now point to the bar of State=CA and Category=Bold, the mouse pointer will become a hand. Click the bar and the result will be regenerated.
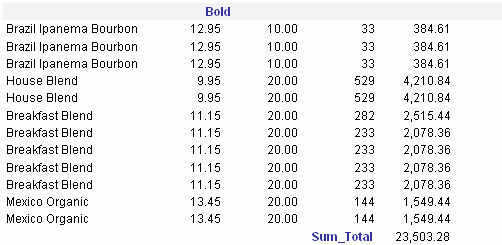
- If you click a label on the category axis of the chart, you will go to detailed information concerned with the product category represented by that label; if you click a series axis label, detailed information about the state indicated by the label will be displayed.
Notes:
- The Go to Detail property is enabled by default for summaries on the group header/footer panel of a banded object. This is the same case when the formulas on the group header/footer panel of a banded object are group level formulas.
- Go-to-detail from a summary or group level formula in a banded object can also be performed in view mode in JReport Designer, and in HTML/PDF report outputs.
- For a chart, its Hyperlink, X Hyperlink, and Z Hyperlink properties allow you to set a URL for the graphic objects (such as bars, benches, and so on), category axis labels, and series axis labels respectively. If you have set any of the three properties, the corresponding object will no longer support the go-to-detail function in Page Report Studio, and clicking it will go to the URL. If Interactive is set to true and you have set Hyperlink, X Hyperlink, and/or Z Hyperlink, double-clicking the corresponding part of the chart will go to the URL you set.
- If there is no other actions bound on the object which is enabled with the go-to-detail action, you can also directly click the object to get the detail information at runtime. If there is other actions bound on the object, you can click the object to obtain the detail information only when the go-to-detail action is specified with the highest click priority.