Chart Wizard for page report
This wizard appears when you select the Chart layout in the New Page Report Tab dialog or New Page Report dialog and click OK, or right-click a chart in a page report and click Chart Wizard from the shortcut menu. It helps you create or modify a chart.
The wizard consists of the following screens:
Back
Goes back to the previous screen.
Next
Goes to the next screen.
Finish
Finishes creating or modifying the chart and closes this wizard.
Cancel
Does not retain changes and closes this wizard.
Help
Displays the help document about this feature.
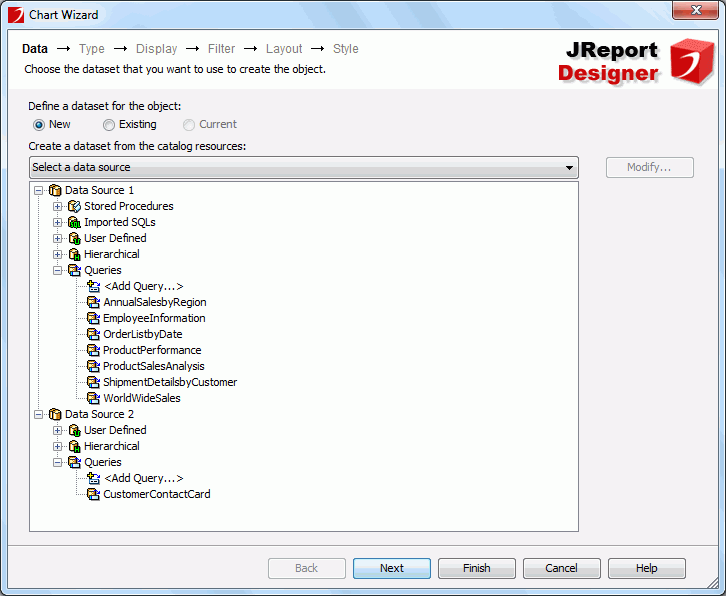
Data screen
Specifies the dataset for the chart. See the screen.
Define a dataset for the object
Specifies the dataset you want to use to create or modify the chart.
- New
If checked, select a data source from the catalog resources to create a dataset that will be used to build the chart. When you choose to create the dataset from a query, you can click the Modify button to edit the query in the Query Editor if required.
- Existing
If checked, select a dataset from the ones existing in the open report to create the chart. Click the Modify button to edit the dataset in the Dataset Editor if required.
- Current
If checked, the current dataset used by the parent object will be applied to the chart.
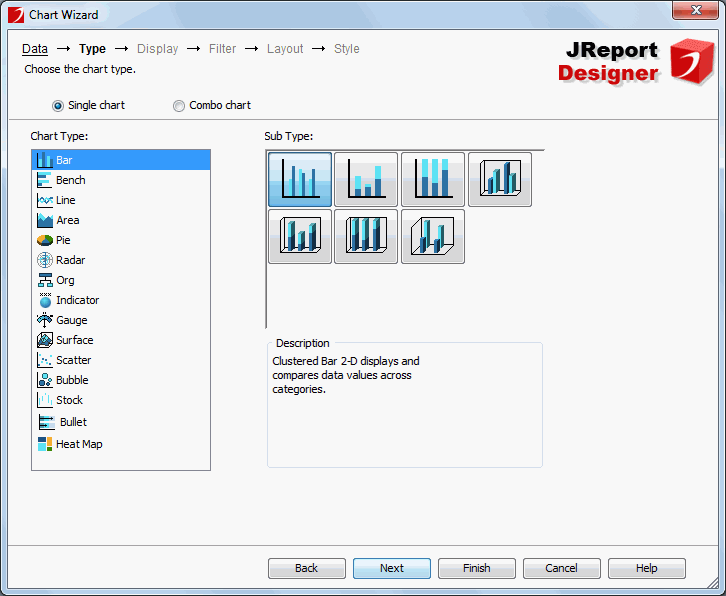
Type screen
Specifies the type of the chart. You can refer to the section Chart types which describes each of the chart type in detail. See the screen.
Single chart
Specifies to create a single chart.
- Chart Type
Lists all the chart types that can be used to create a single chart.
- Sub Type
Lists all the sub types of the selected chart type.
- Description
Displays the description of the selected chart type.
Combo chart
Specifies to make more than one type use the primary or secondary axis. The types should be featured as Combination charts. Two types of data markers are used to represent different data values.
- Chart Type
Lists all the chart types that can be added as a combo chart.
- Sub-Type
Lists all the sub-types of the selected chart type.
- Description
Displays the description of the selected chart type.
- Chart Type Groups
Lists all the chart types that are to be used in the combo chart.
- Primary Axis
- <Add Combo Type>
Adds a chart type to the primary axis.
- Secondary Axis
- <Add Combo Type>
Adds a chart type to the secondary axis.

Removes a specified chart type from the Chart Type Groups box.
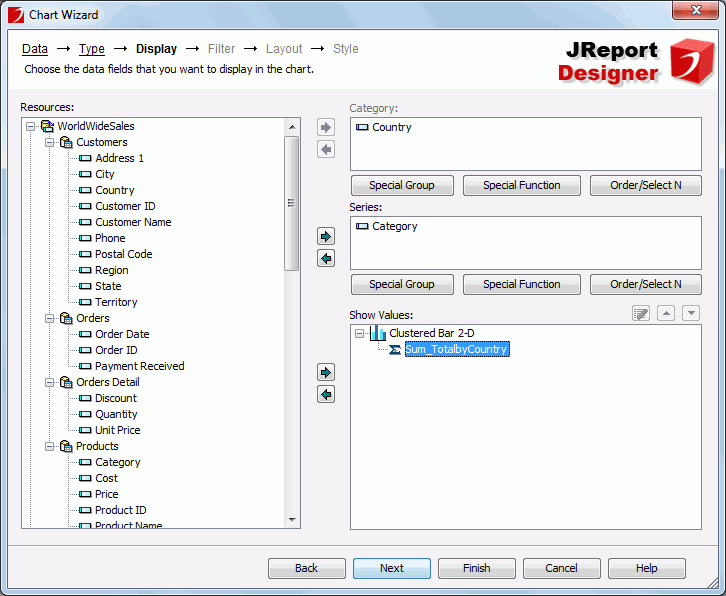
Display screen
The Display screen differs with chart types: common chart types, org chart, or heat map.
Display screen for common chart types
Specifies the data displayed on the chart. See the screen.
Resources
Lists all the available data resources in the selected dataset.

Adds the selected fields to be displayed in the chart.

Removes the selected fields from the chart if they are not required.

Replaces the selected field in the chart with the specified field in the Resources box.
Category/Series
Lists the field you want to display on the category/series axis of the chart.
For a real time chart, if no field is specified on the category axis, Use System Refresh Time will be automatically displayed in the Category box, namely, the time at which the chart refreshes itself will be used as the category value; the series axis will be disabled.
Show Values
Lists the values you want to show in the chart. For a real time chart, the values you add must be of Numeric type and cannot be summary fields.

Opens the Edit Additional Value dialog to edit an additional value. Available only when a constant value or an average value is selected in the Show Values box.
Moves the selected value one step up. 
Moves the selected value one step down.
Adds a new pair of Y Axis and Radius for the bubble chart.
Removes the selected field from the bubble chart if they are not required. - X Axis
Lists the value you want to show on the X axis of the bubble chart.
- Y Axis
Lists the value you want to show on the Y axis of the bubble chart.
- Radius
Lists the value you want to show as the bubble radius.
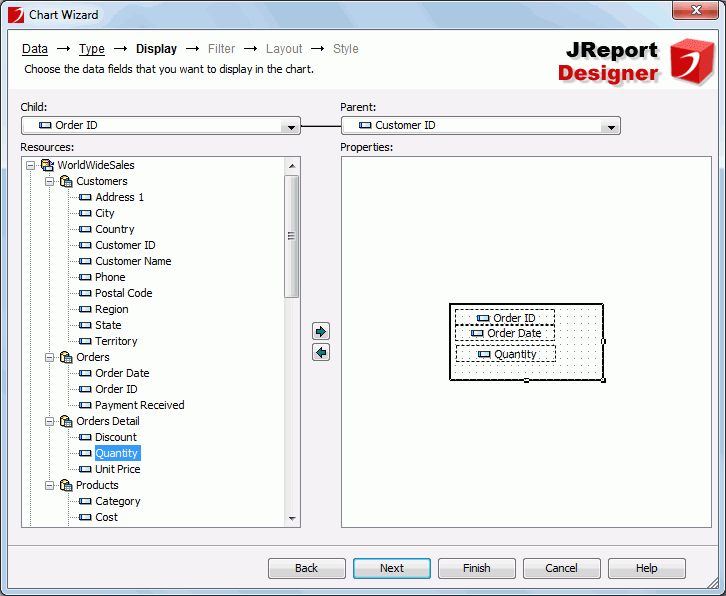
Display screen for org chart
Specifies the data displayed on the chart. See the screen.
Child
Specify a field from the drop-down list which identifies the entity.
Parent
Specify a field from the drop-down list which shows the "reporting to" relationship among the entity members, that is, which child field member reports to or belongs to which child field member.
Resources
Lists all the available resources that can be added in the org chart.
Properties
The Properties box presents a node model of the org chart. Data fields, labels and images can be inserted into the node as the information about the entity in the org chart.
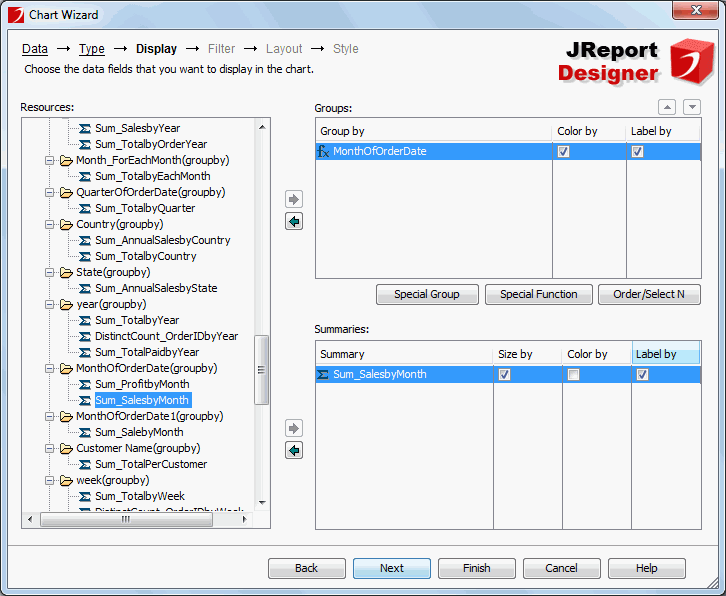
Display screen for heat map
Specifies the data displayed on the chart. See the screen.
Groups
Lists the fields used to group the data. There should be at least one group.
- Color by
Specifies whether to color by a group. 0-n groups can be used as the color-by fields.
- Label by
Specifies whether to show a group field in the innermost rectangle. 0-n groups can be used as the label-by fields.
- Special Group
Opens the User Defined Group dialog to define how to group information.
- Special Function
Opens the Special Function dialog to define some special function to the field.
- Order/Select N
Opens the Group Options dialog to specify the sort order of the group values and define the number of the group values that will be displayed in the chart.
Summaries
Lists the summaries used as size-by/color-by or displayed in the innermost rectangle.
The summaries should match the groups. For example, if the groups level is A > B > C, the static summaries grouped by C can be inserted into the Summaries box, but the static summaries grouped by A, B or other fields cannot.
If no group is specified in the Groups box, you can insert any static summary. And its group-by field will be inserted into the Groups box automatically.
- Size by
Specifies to size by one summary or none.
- Color by
Specifies to color by one summary or none.
- Label by
Specifies whether to show a summary in the innermost rectangle. 0-n summaries can be used as the label-by fields.
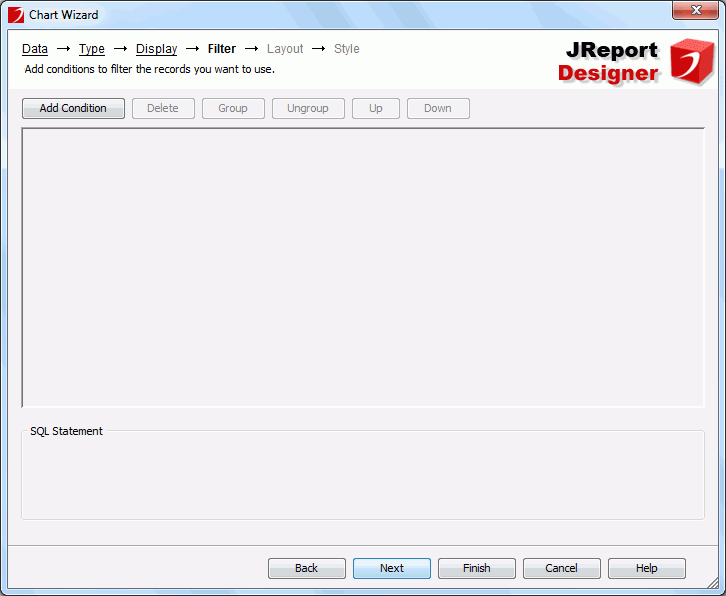
Filter screen
Specifies to filter the data used in the chart. This screen is available only when you create a chart. See the screen.
For details about options in the screen, see Edit Filter dialog.
Layout screen
The Layout screen differs with chart type: common chart types, org chart, or heat map.
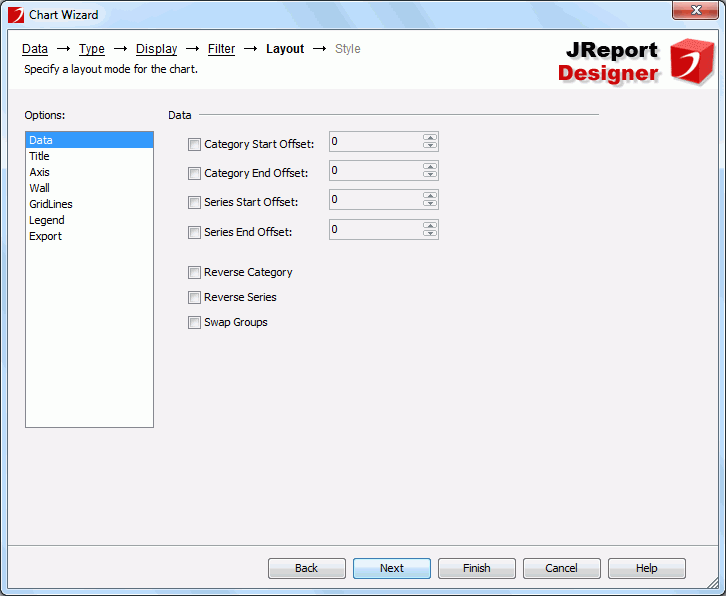
Layout screen for common chart types
Specifies the layout of the chart elements. See the screen.
Data
- Category Start Offset
Specifies the start offset of category from which the chart will be displayed.
- Category End Offset
Specifies the end offset of category to which the chart will be displayed.
- Series Start Offset
Specifies the start offset of series from which the chart will be displayed.
- Series End Offset
Specifies the end offset of series to which the chart will be displayed.
- Reverse Category
Specifies whether to reverse the display order of the categories.
- Reverse Series
Specifies whether to reverse the display order of the series.
- Swap Groups
Specifies to display values from different data fields by switching data between the category and series axes, the category and values axes.
Notes:
- If values are set to be less than 0, it means the categories or series will be displayed without any offset.
- If values are set to be greater than 0 and the value of Category/Series Start Offset is greater than that of Category/Series End Offset, all of the categories or series will be displayed.
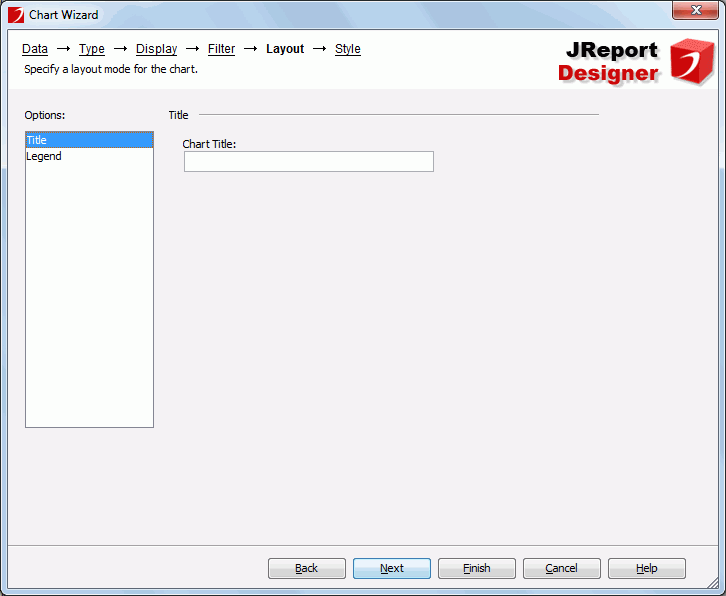
Title
- Chart Title
Specifies the title of the chart.
- Category (X) Axis Title
Specifies the title of the X-axis.
- Value (Y) Axis Title
Specifies the title of the Y-axis.
- Value (Y2) Axis Title
Specifies the title of the Y2-axis.
Axis
- Show Category (X) Axis
Specifies whether to show the category (X) axis in this chart.
- Show Value (Y) Axis
Specifies whether to show the value (Y) axis in this chart.
- Show Value (Y2) Axis
Specifies whether to show the value (Y2) axis in this chart.
- Show Series (Z) Axis
Specifies whether to show the series (Z) axis in this chart.
Wall
- Show Wall
Specifies whether to show the wall in this chart.
- Show Floor
Specifies whether to show the floor in this chart.
Gridlines
- Show Category (X) Axis Gridlines
Specifies whether to show the gridlines of category (X) axis.
- Show Value (Y) Axis Gridlines
Specifies whether to show the gridlines of value (Y) axis.
- Show Value (Y2) Axis Gridlines
Specifies whether to show the gridlines of value (Y2) axis.
- Show Series (Z) Axis Gridlines
Specifies whether to show the gridlines of series (Z) axis.
Legend
- Show Legend
Specifies whether to show the legend in this chart.
Export
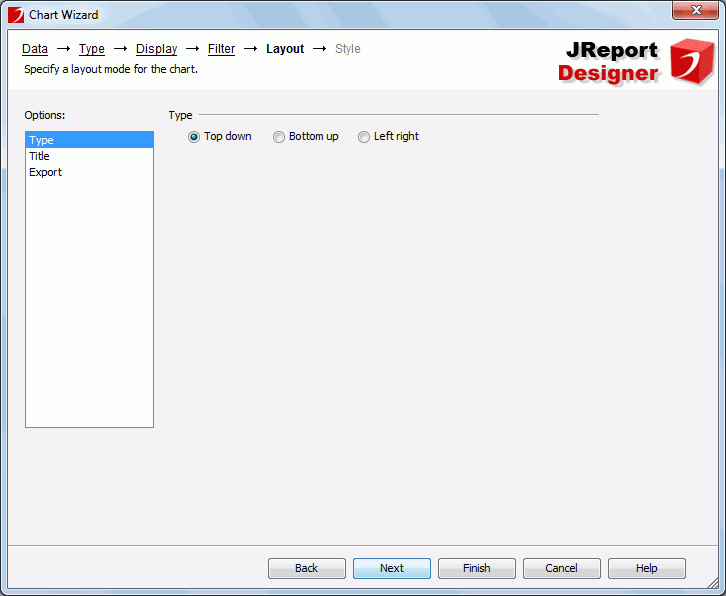
Layout screen for organization chart (org)
Specifies the layout of the chart elements. See the screen.
Type
Specifies the layout mode of the org chart.
- Top down
The org chart tree expands from top to bottom.
- Bottom up
The org chart tree expands from bottom to top. It is the reverse of the top down type.
- Left right
The org chart tree expands from left to right.
Title
- Chart Title
Specifies the title of the chart.
Export
Layout screen for heat map
Specifies the layout of the chart elements. See the screen.
Title
- Chart Title
Specifies the title of the chart.
Legend
- Show Legend
Specifies whether to show the legend in this chart.
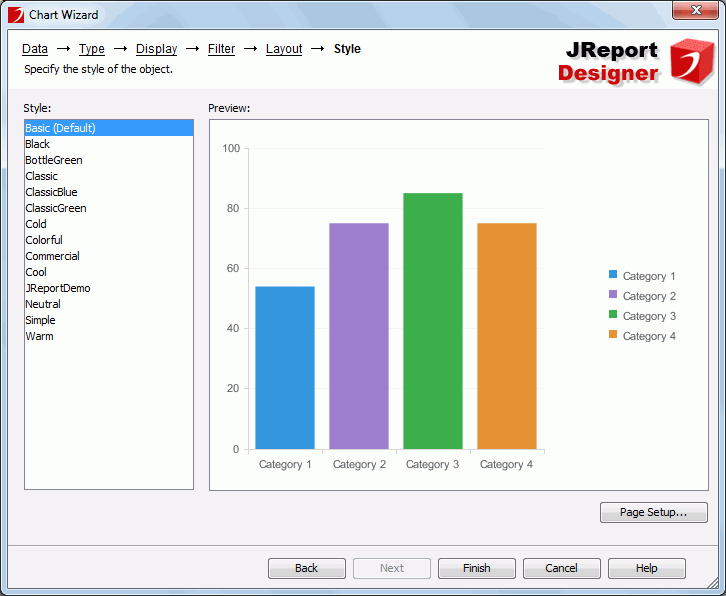
Style screen
Specifies the style of the chart. See the screen.
Style
Lists the available styles.
- <Custom>
There is no any style information on it and it is only used to cover previous-version report which did not bind any style or the bound style cannot be found in the style list.
Preview
Displays a diagram illustrating the effect of the selected style on the chart.
Inherit Style
Specifies whether to make the chart take the style of its parent. This options is available only when you modify a chart and the chart is inserted into a banded object or table in a page report.
Page Setup
Opens the Page Setup dialog to specify page properties. Available only when creating a page report.
Related topics: